Analytics Dashboards
The Analytics section of DataHub has up to two pages:
- Usage Stats shows your organization's usage of DataHub Cloud's metered products, and how it tracks against your contract's allowances.
- Product Analytics shows what's in your catalog and how your team is adopting DataHub.
When Usage Stats is enabled for your organization, it appears as the first tab. Otherwise, Product Analytics is the only page under Analytics.
Usage Stats
Usage Stats gives you an always-current view of your organization's usage of DataHub Cloud's metered products. If your contract includes allowances for them, it also shows how your usage is tracking against what's included — so you can see where you stand at any time, not just at renewal. Dates on this page are in UTC.
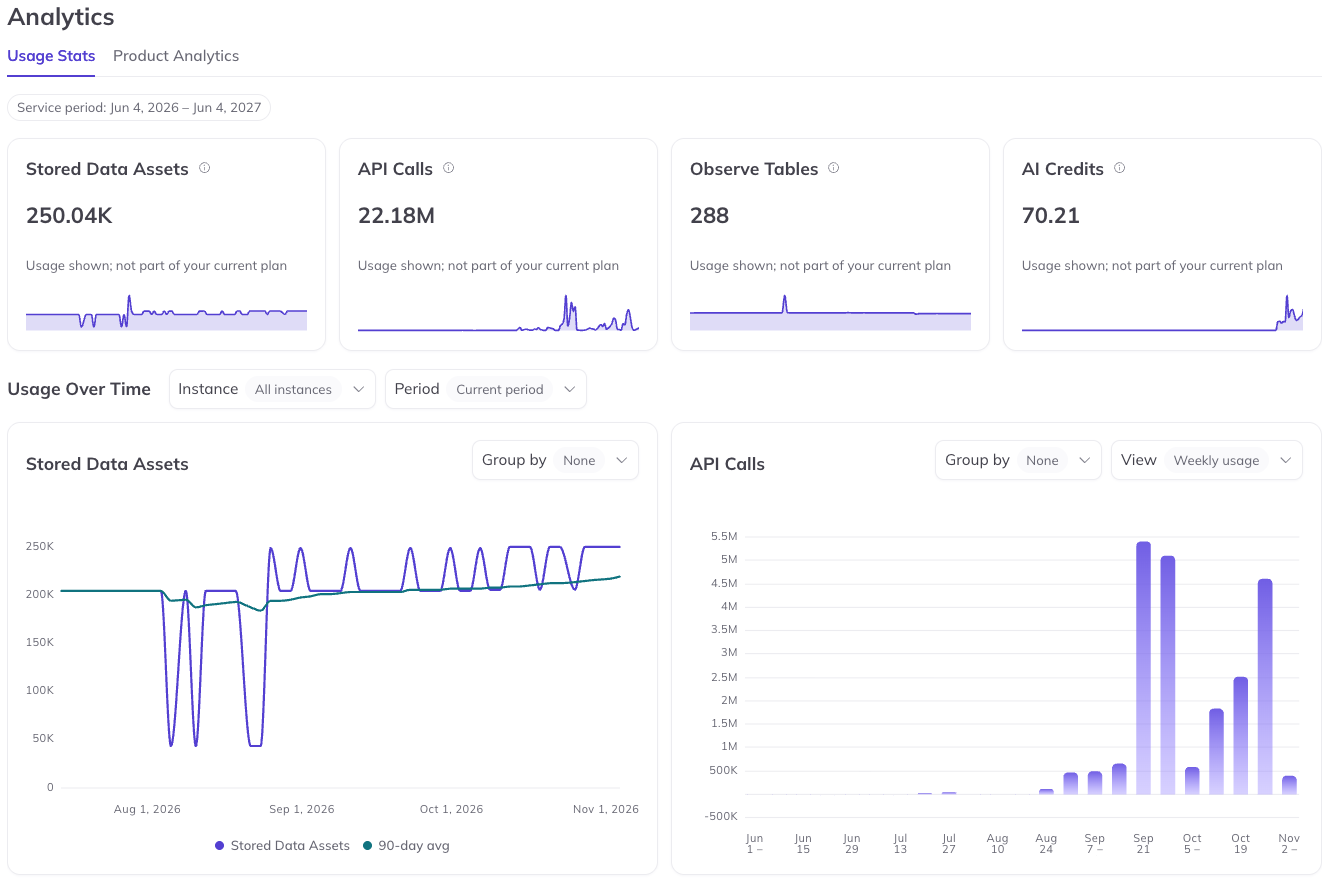
Usage Stats is in public beta, rolling out customer by customer behind a feature flag, and viewing it requires the View Billing Dashboard platform privilege (admins have it by default and can grant it to others). If you don't see the page, ask your DataHub admin — they can grant you access, or request the feature from your DataHub representative.
Metered Usage Cards
Each metered product gets its own card: a chart of your usage over time. If your contract includes an allowance for that product, the card also shows it, so you can see how you're tracking against what's included for the period.
| Product | What the card shows |
|---|---|
| Stored Data Assets | Your current number of assets (datasets, dashboards, charts, and more) stored in DataHub |
| API Calls | All metered calls to DataHub across the MCP, REST/OpenAPI, and GraphQL APIs |
| AI Credits | Running total of AI credits used in the period |
| Observe Tables | Your current number of tables monitored by Observe assertions |
| Ask DataHub Answers | Questions answered by Ask DataHub, if your contract has a dedicated allowance for it |
On newer contracts, Ask DataHub usage draws from AI Credits instead of having its own card.
Usage Over Time
Dig into any metric over a period of your choosing:
- Period presets — current period, forecast to period end, last 24 hours, last 30 days, last 90 days, or last year — or set a custom date range.
- Instance filter — if you run multiple DataHub instances (say, dev and prod), filter the dashboard down to a single instance.
- Group by — break a chart down by Instance, by Call type for API Calls (MCP vs. REST/OpenAPI vs. GraphQL), or by AI Module for AI Credits to see which AI features are using them.
- Views — daily, weekly, or monthly usage, cumulative totals, or a burn-down against your allowance.
Two more charts track adoption alongside the metered products: Monthly Active Users and Active Data Sources.
Upcoming Credits
Allowances and credits from your contract that haven't taken effect yet, each with its start date and, if it has one, its end date. Once a credit takes effect it leaves this list — you'll see it reflected in the metered usage cards at the top of the page.
Fair Use
Live hourly charts for the operational dimensions covered by DataHub's fair use policy:
- API Calls per Hour
- Metadata Ingested per Hour
- Active Observe Assertions
A link to the fair use policy sits beside the charts.
Product Analytics
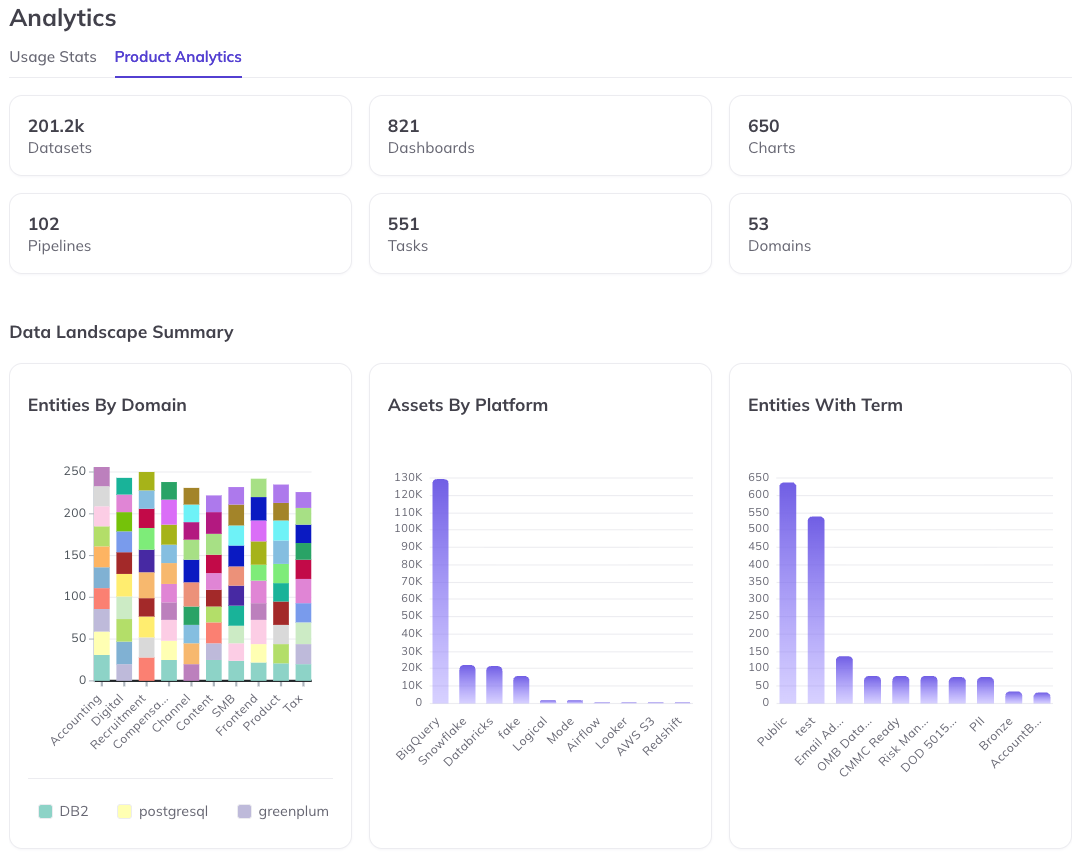
Product Analytics shows how your organization is adopting DataHub — what's in your catalog and how people are using it.
Highlight Tiles
At-a-glance counts of the assets in DataHub. Weekly and Monthly Active Users appear here when Usage Stats isn't enabled; otherwise you'll find them on the Usage Stats page.
Data Landscape Summary
A snapshot of your catalog (what's in it, not how it's used):
- Entities By Domain — stacked chart of entities by type within each domain
- Assets By Platform — number of assets per platform
- Entities With Term — number of entities with glossary terms applied
- Entities By Environment — number of entities per environment
Domain Landscape Summary
The same charts as the Data Landscape Summary, scoped to a single domain you pick from a dropdown.
Usage Analytics
How your team actually uses DataHub:
- Weekly and monthly active user trends (shown here when Usage Stats isn't enabled)
- New Users and Top Users over the last 30 days, with names, titles, and emails
- Number of Searches over time, plus Top Searches from the past week
- Top Viewed Datasets and Top Viewed Dashboards from the past week
- Tab Views by Entity Type and Actions by Entity Type from the past week
Ask DataHub
Only visible on DataHub Cloud.
- Ask DataHub Weekly Active Users
- Questions Asked over the past 3 months
- Questions by Platform over the last 30 days
- Top Ask DataHub Users and Top Tools Used over the last 30 days
MCP
Only visible on DataHub Cloud.
- MCP Sessions over the past 3 months
- MCP Weekly Active Users
- Top MCP Users and Top MCP Tools over the last 30 days