Anomaly Detection ⚡
What is Anomaly Detection?
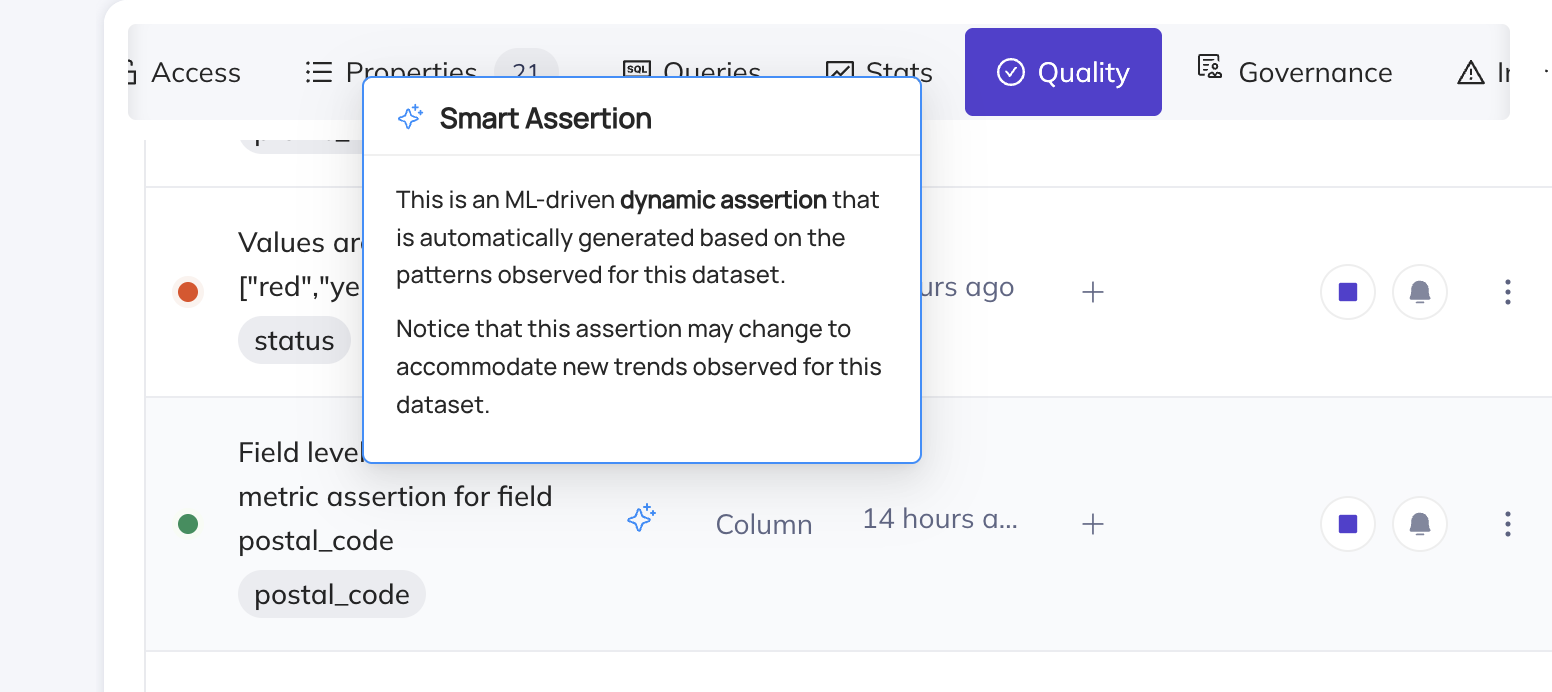
Anomaly Detection is an optional feature that can be enabled on certain DataHub Cloud assertions to replace fixed thresholds with AI-driven thresholds. Instead of you specifying exact bounds (e.g., "row count must stay between 1,000 and 2,000"), the assertion trains on the historical pattern of the underlying metric and alerts when the latest value falls outside what is considered "normal" — accounting for trends, seasonality, and typical variance.
Anomaly Detection was previously referred to as Smart Assertions.
Where can I enable Anomaly Detection?
Anomaly Detection can be enabled on the following assertion types:
| Assertion type | Anomaly Detection stage | Notes |
|---|---|---|
| Freshness | GA | Works for warehouse-based and ingestion-driven signals. When used with the DataHub Operation aspect, it works on any ingested platform that reports Operations (including Clickhouse, Oracle, Dremio, etc.). |
| Volume | GA | Works for warehouse-based and ingestion-driven signals. When used with DataHub Dataset Profile, it works on any ingested platform that reports row count profiles (including Iceberg, Postgres, MySQL, etc.). |
| Column Metric | Public Beta | Limited to the column metrics null_count, unique_count, empty_count, zero_count, and negative_count. Works with both active-query and ingestion-driven sources. |
| Custom SQL | Public Beta | Custom SQL requires an active warehouse connection, so this is Snowflake / Redshift / BigQuery / Databricks only. |
Not supported:
- Column Value assertions — checks like "value matches regex" or "value in set" are deterministic and do not have a statistical notion of "normal".
- Schema assertions — schema changes are discrete events, not anomalies. Use Monitoring Rules to apply Schema assertions at scale across many datasets.
Does Anomaly Detection require a warehouse connection?
No — Anomaly Detection is not limited to Snowflake, Redshift, BigQuery, or Databricks. For Freshness, Volume, and Column Metric, the ML model trains on whichever signal the underlying assertion is configured to use:
- Freshness uses the DataHub
operationaspect. Any platform that reports Operations via ingestion can be monitored with Freshness Anomaly Detection. - Volume uses the DataHub Dataset Profile. Any platform that reports Dataset Profiles via ingestion can be monitored with Volume Anomaly Detection.
- Column Metric uses the DataHub Dataset Profile / SchemaFieldProfile. Any platform that reports these via ingestion can be monitored with Column Metric Anomaly Detection.
Only Custom SQL Anomaly Detection requires an active warehouse connection, because Custom SQL itself requires one.
When running in ingestion-driven mode, the evaluation cadence of the assertion is bounded by your ingestion cadence (the assertion refreshes when the underlying aspect is refreshed).
See the capabilities matrix for the full picture of which assertion types support which signal sources on which platforms.
Time-Series Bucketing
Time-series bucketing is currently in Public Beta. It is available to all DataHub Cloud customers; we welcome feedback as we continue to iterate.
Anomaly Detection can be configured with time-series bucketing to evaluate data quality at a day or week granularity. Instead of checking the entire table each time, the assertion partitions rows into time buckets using a timestamp column and evaluates each bucket independently.
This is especially powerful for Anomaly Detection because it enables the model to learn patterns like "Mondays always have higher volume" or "weekend null counts are typically lower", leading to more accurate anomaly detection.
Time-series bucketing is supported for:
Bucketing requires an active warehouse query, so it is only available on Snowflake, Redshift, BigQuery, and Databricks.
Backfill Assertion History
Backfill is currently in Private Beta — contact your DataHub Cloud representative to request access.
When you enable Anomaly Detection with time-series bucketing, you can optionally backfill historical data so the AI model has enough context to make accurate predictions from day one. Without backfill, the model needs to accumulate data over days or weeks of scheduled evaluations before it can reliably detect anomalies.
With backfill enabled, the system queries your warehouse for historical data and populates the assertion's metrics history immediately. This means you get meaningful anomaly detection thresholds right away, with full awareness of seasonality patterns.
For full details on how backfill works, how to configure it, and how to retry failed backfills, see the dedicated Backfill Assertion History page.
Improving Anomaly Detection quality
You can improve predictions through two key levers:
- Tuning
- Anomaly feedback
Tuning
You can fix most Anomaly Detection results with 3 key actions — correct training data, adjust sensitivity, and increase the lookback window. Each of these can be accessed via the Tune Predictions button on the Assertion Profile, or the Settings tab.
Exclusion Windows Set time windows to exclude from training data. This can be useful to exclude known maintenance windows or other periods of downtime, seasonal spikes e.g. holidays, or any other windows that are not representative of normal data trends.
Sensitivity A higher sensitivity will have a tighter fit on the data. A lower sensitivity will allow for more data variation before an anomaly is flagged.
Training data lookback window This is the number of days our ML models will look back to gather training data to generate predictions. If this is too large, we may pick up on old data that is no longer part of the current trend. If it is too short, we may miss key seasonal patterns. You can leverage this alongside exclusion windows to improve the quality of predictions.
Anomaly Feedback
False alarms
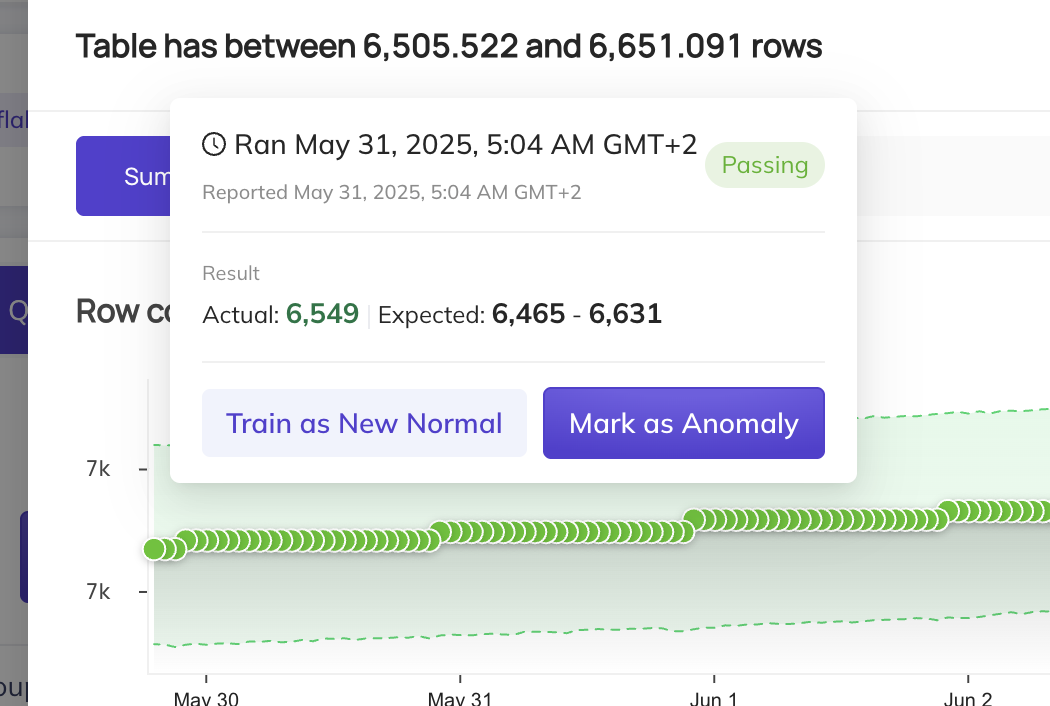
When an anomaly is flagged, you may hover over the result dot and select Mark as Normal. This will include this data point in the training set, and the model will adjust to ensure it does not flag such data points as anomalies again.
However, there are some cases where anomalies are actually expected. For instance, if this is a sudden jump in data, but it will be the new normal moving forward, we recommend selecting the Train as new Normal option. This will add an exclusion window to all data prior to this run event, and the model will begin training on data points from this point forward.
Missed alarms
If an anomaly is not caught, we recommend doing a few things:
- You can click
Mark as Anomalyto flag this specific data point as an anomaly. This will exclude that data point from the training data. - Click Tune Predictions on the assertion, then exclude any "bad" historical periods from the training set (by adding an
Exclusion Window). This is useful if older incidents or one-off events are polluting the model's notion of "normal". - Finally, consider increasing the sensitivity of the assertion in the Settings tab, which will reduce the range of allowable values.
Applying Anomaly Detection at scale
If you want to roll out Anomaly Detection across many datasets at once rather than configuring each assertion individually, use Monitoring Rules on the Data Health Dashboard. Monitoring Rules let you define a search predicate (e.g. a domain, platform, or schema) and automatically apply Freshness and Volume Anomaly Detection monitors — plus standard Schema assertions — to all matching datasets. As your data landscape evolves, new datasets that match the predicate are automatically covered.