Visualizing Your Ontology
Ontology is currently in Private Beta. Features, UI, and configuration options are subject to change.
A graph makes things easy to spot that a list does not: which concepts are central, which are orphaned, and where two teams have modelled the same idea twice.
DataHub gives you two views of the same graph: a global view across the whole glossary, and a focused view anchored on one term.
Available in DataHub Cloud v2.2.1 and later.
The global view
Navigate to Govern → Ontology in the left sidebar. This renders every glossary term that participates in at least one relationship, laid out automatically.
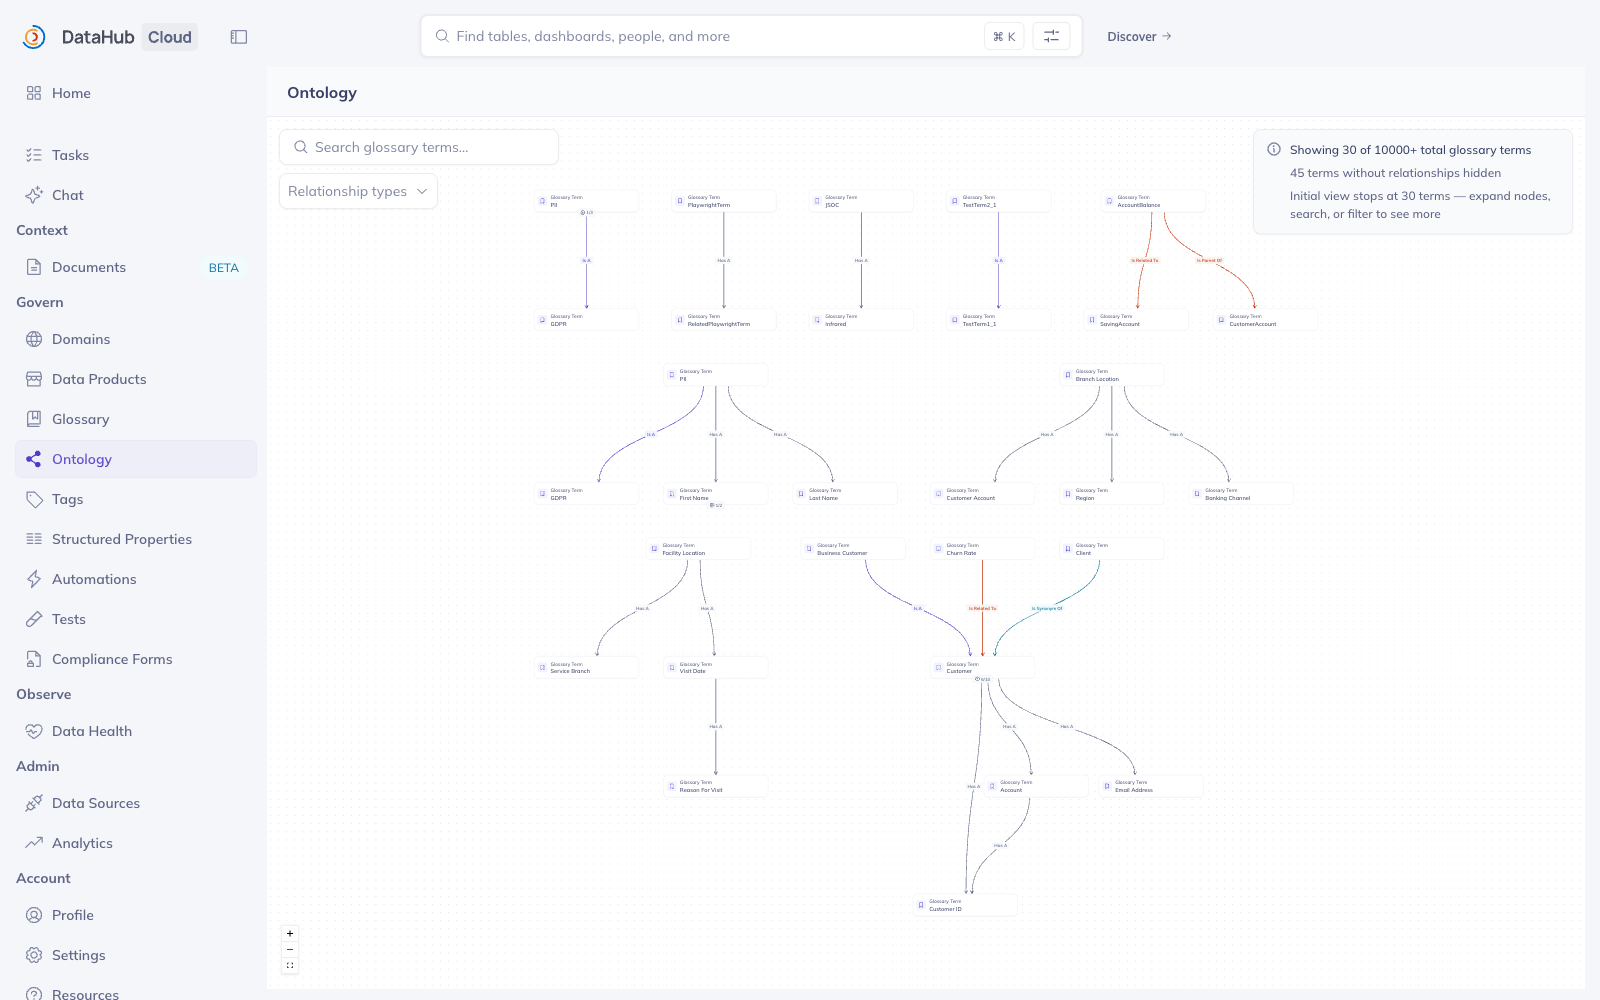
Terms with no relationships at all are hidden — they carry no information in a relationship graph, and hiding them keeps the layout readable. The info bar at the bottom tells you how many were left out.
Two controls sit at the top left:
- Search filters the graph to terms matching your query, along with the terms they are connected to. Use the up/down arrows in the search bar to step through matches; the graph pans to each one.
- Relationship types filters the graph to specific relationship types. Selecting only Inherits, for example, collapses the graph down to your concept taxonomy and hides everything else. Each type shows how many edges of that type exist.
On a large glossary the initial view is capped at a fixed number of terms so the first render stays fast. The info bar says when the cap is in effect. Expand individual nodes, search, or filter by relationship type to reach beyond it.
Reading the graph
- Each node is a glossary term. Click a node to open its details; click Expand on a node to pull in its neighbours that are not currently drawn. A node with more neighbours than are drawn shows a count badge.
- Each edge is a relationship, labelled and colour-coded by its type —
Is A,Has A,Is Synonym Of,Is Related To, and any custom types. Directed edges are drawn with an arrow pointing from source to destination. Hover an edge to see its type, whether it is directed, and whether it is transitive.
Edge labels use the underlying relationship type names (Is A, Has A), while the Related Terms
tab uses the friendlier display names for the same relationships (Inherits, Contains).
The focused view
Every glossary term has a Relationships tab that shows the same graph, anchored on that term.
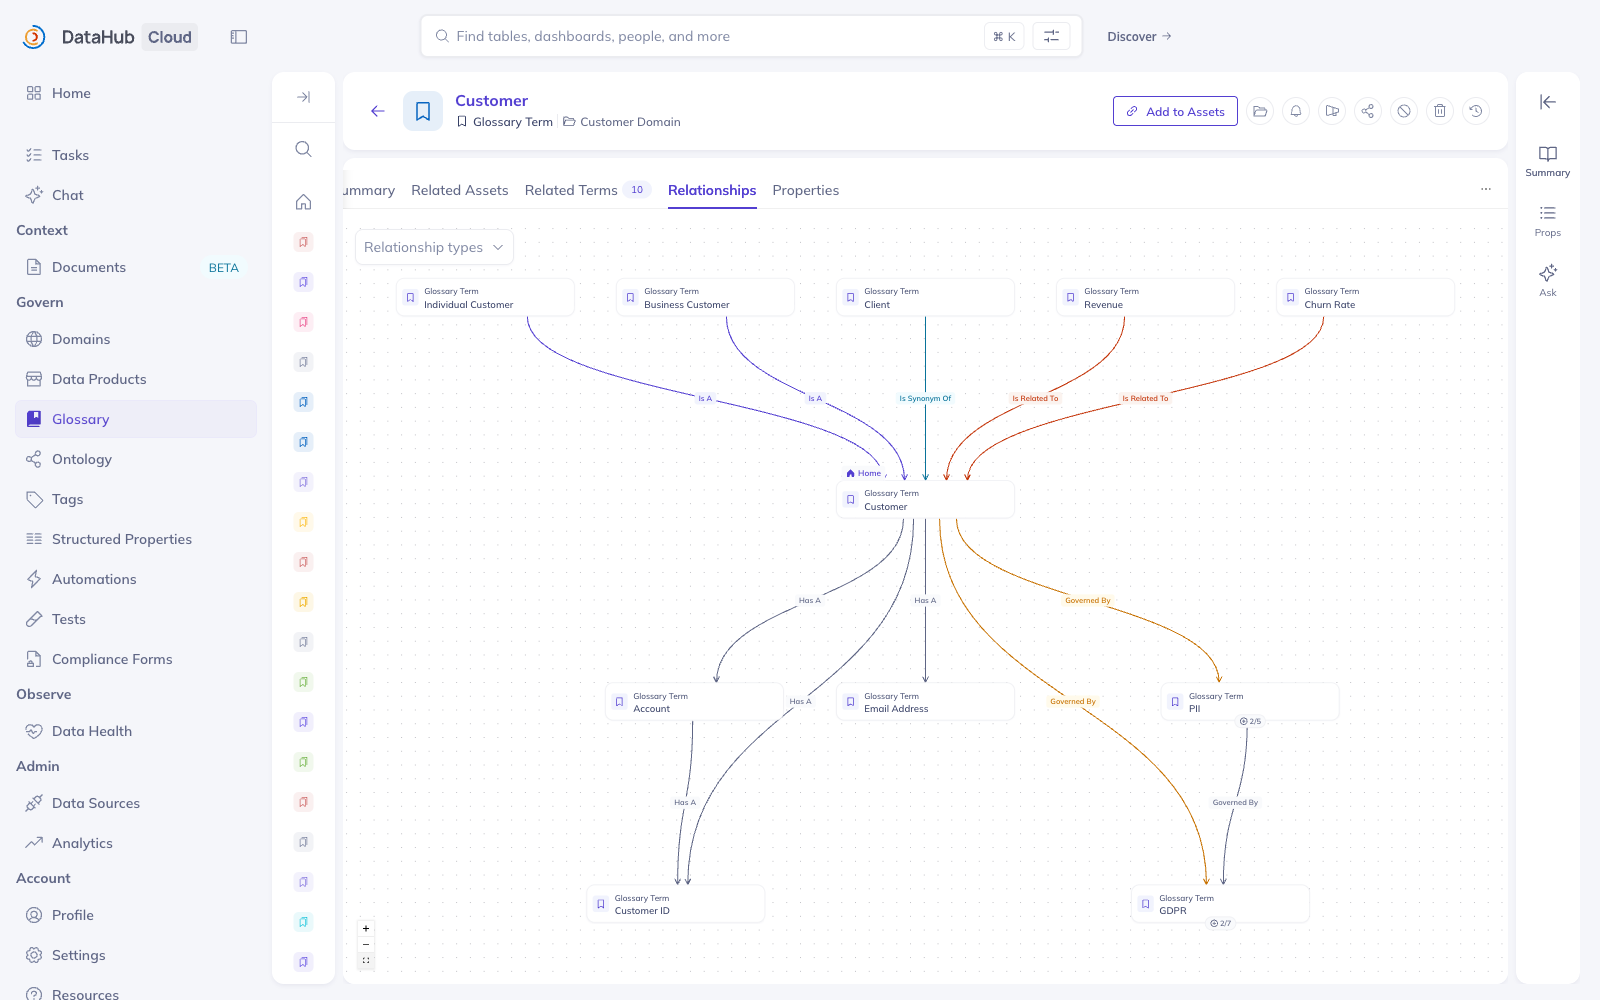
This is the view to reach for when you are answering a question about one concept: what depends on Customer?, what does Revenue connect to? The anchor term is badged as Home, and the graph starts one hop out. Expand any neighbour to walk further.
Because the tab is anchored, search is hidden here. The relationship-type filter still applies.
You can also deep-link to the focused view directly, which opens the same graph on the full-width Ontology page:
https://<your-datahub>/ontology?urn=urn:li:glossaryTerm:customer
Related Terms vs. Relationships
A glossary term has two tabs that both show relationships:
- Related Terms is a tabular view, grouped by relationship type. It supports editing — this is where you add and remove relationships.
- Relationships is a graphical view. It is read-only, but it shows more than one hop, so you can explore outward from the term.
Empty states
An empty graph means one of the following:
- "No glossary terms yet" — the glossary itself is empty. Create terms first.
- "No relationships between glossary terms" — you have terms but no relationships. See Relating Glossary Terms.
- "No relationships yet" (focused view) — this particular term has no relationships, though others do.
- "No matching glossary terms" — your search or relationship-type filter excluded everything.
Enabling this feature
Contact your DataHub representative to have this enabled for your instance.
For self-managed deployments, set the flag on GMS and restart:
SHOW_ONTOLOGY_GRAPH=true
Or via Helm:
datahub-gms:
  showOntologyGraph: true