Step 2: Ingest Context
Your baseline shows where your agent stands. The fastest way to improve it is with context your team has already written: semantic models, BI definitions, and documentation. Today, that knowledge is usually fragmented across tools. This step activates it by centralizing it in DataHub, in one place your agent can search.
Connecting your warehouse has already given your agent a lot: tables, columns, lineage, owners, usage, and past queries. These are the trust signals it uses to choose the right data. What it still lacks is meaning: what your metrics are, and how your team thinks about its data.
If you have a semantic layer, start with Semantic models and metrics. It's the most precise context you own.
If you don't, go straight to Documentation and Strengthen the basics. Step 3 will generate much of what's missing.
Semantic models and metrics
Semantic models and metrics are precise, reviewed definitions. In DataHub, they're assets just like tables: your agent can find them, and your evals can reference them.
| Source | What your agent learns | How to enable it |
|---|---|---|
| Snowflake semantic views | Metric definitions and the tables behind them | In your Snowflake connection, set semantic_views.enabled: true |
| dbt semantic models | Entities, dimensions, measures, and the models they use | Enabled by default in the dbt connection (dbt 1.6 and later) |
| Databricks metric views | Dimensions, measures, and the tables behind them | In your Databricks connection, set include_metric_views: true |
| Looker | Explores, fields, and how tables join | Connect Looker |
| Cube | Cubes, views, and metric definitions | In your Cube connection, set emit_semantic_model_entities: true |
For other tools, add definitions with the Python SDK. See Metrics & Semantic Models for details. Support for standalone dbt metrics (MetricFlow) is coming soon.
Documentation
Next, bring in the pages where your team explains how things work: metric definitions, data dictionaries, calculation guides, and known issues. In DataHub, they become context documents that your agent can search in plain language.
Go to Documents > Import and choose Notion, Confluence, GitHub, or Upload files. You can import once or keep documents in sync on a schedule. You can also write documents directly in DataHub.
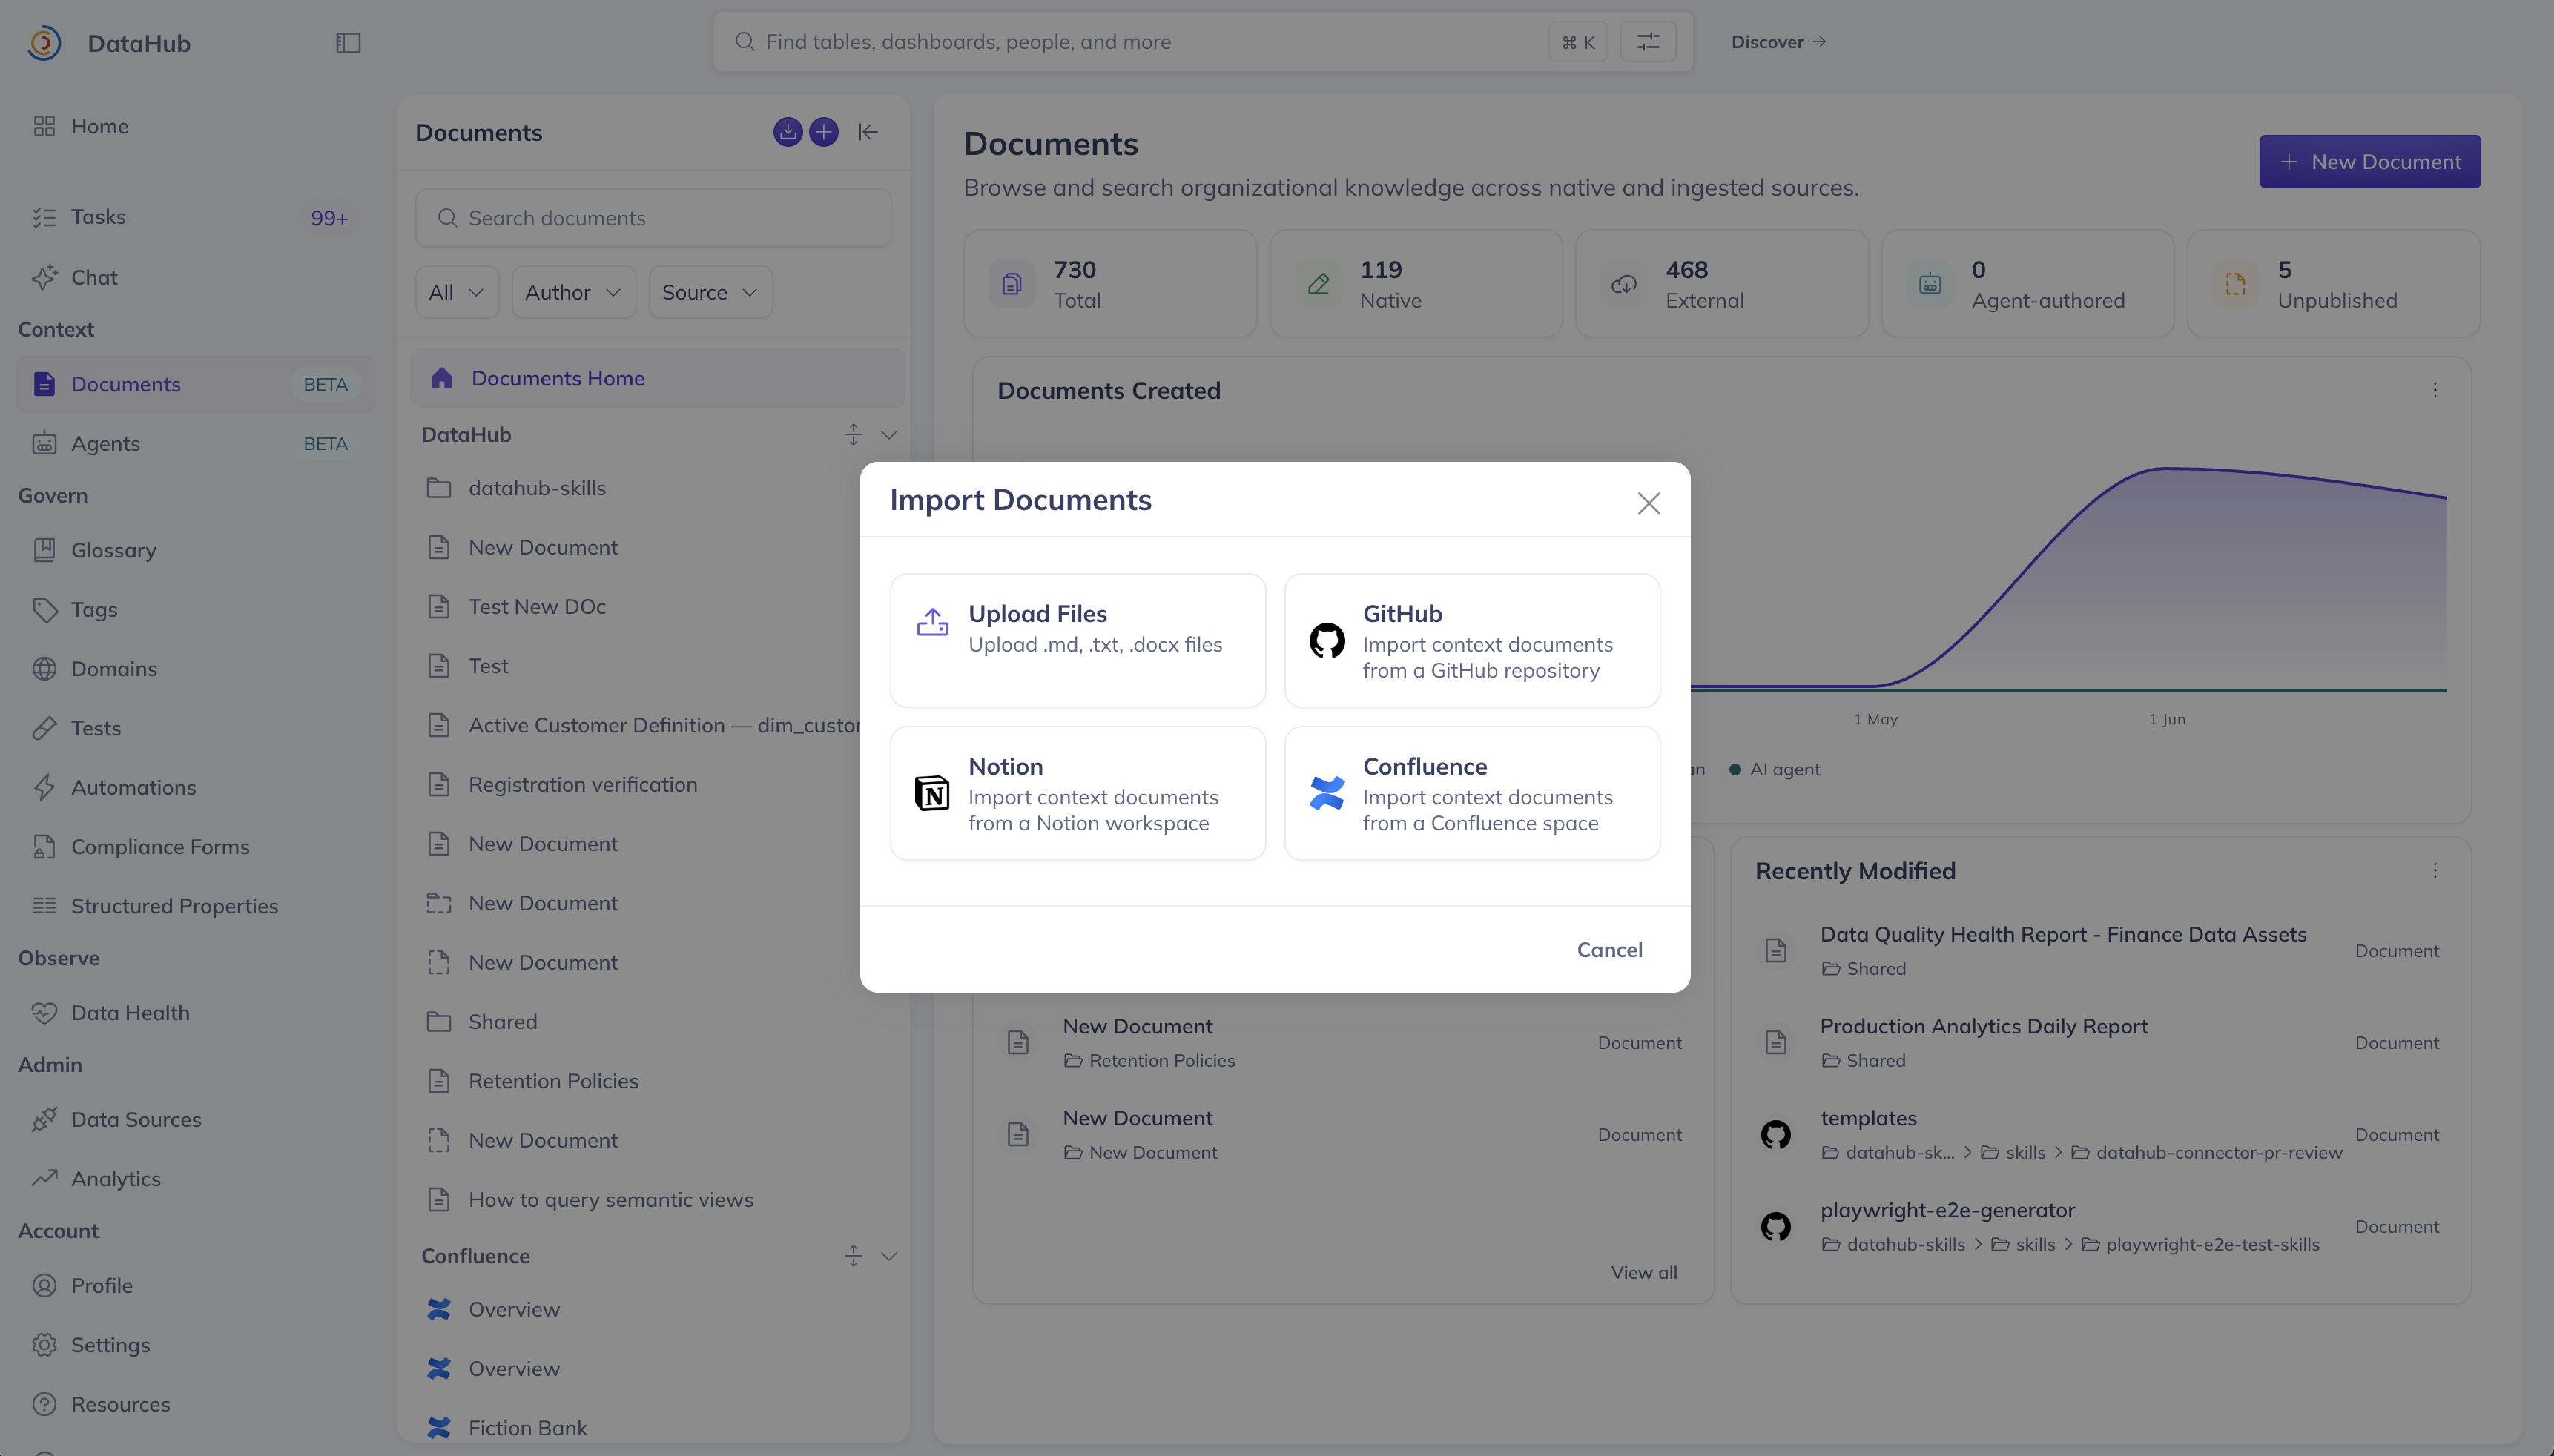
Screenshot: choosing a source to import documents from.
Agents trust what they read, so outdated pages do more harm than good. Import the spaces your team actively maintains, and leave the archives behind.
Strengthen the basics
A few hours here pays off in every answer. You can do all of this from a table's page in DataHub.
- Deprecate look-alike tables. If people keep querying an outdated copy by mistake, mark it deprecated. Your agent will avoid it.
- Document guardrails. For your most error-prone tables, write a short document with the rules people learn the hard way ("filter out
is_test", "amounts are in cents"), and relate it to those tables. Your agent sees it whenever it looks them up. - Describe your key tables. Start with the ten or twenty that matter most. A sentence each is enough.
- Assign owners, so DataHub knows who reviews changes.
- Define key terms, such as "active customer," in the Business Glossary, and link them to the columns that implement them.
- Assign everything to your domain, including documents, so you can point your agent at this area later.
Each of these is a signal DataHub uses to rank what your agent sees. See Technical context.
Re-run your evals
Click Run all DataHub evals. Failures caused by missing definitions or the wrong table should start passing. What still fails is usually the long tail: questions no one has documented. Step 3 addresses those.
Check your work
- Your semantic models and metrics, if you have them, appear in DataHub.
- Your team's most useful documentation is imported, and assigned to your domain.
- Your key tables have owners and descriptions, and outdated copies are deprecated.
- Your pass rate has improved on the baseline.
Next: Step 3: Generate context